Quantitative NBA Modeling and Forecasting
Even-Odds leverages a custom built play-by-play basketball simulation engine. I simulate thousands of games for each matchup at the possession level, and post the results here. I also track model performance vs actual results, and benchmark against the lines put out by sportsbooks.
In contrast with traditional Machine Learning approaches to sports forecasting, the simulation engine is able to capture
rich low level details and provides a framework for accurately pricing correlated outcomes within a single game.
View Daily Forecasts and Charts
A modern NBA forecasting lab
Simulation-driven predictions, tracked results, and transparent write-ups — built for fans, bettors, and data-driven decision makers.
Daily Forecasts
Nightly projections for tomorrow’s slate — spreads, totals, and win probabilities. Clear “why” notes, not just a number dump.
Simulation-Driven Model
Predictions are generated from a possession-level simulation pipeline built from NBA play-by-play structure. The goal: realistic game scripts, not overfit box-score averages.
Third-Party Performance Tracking
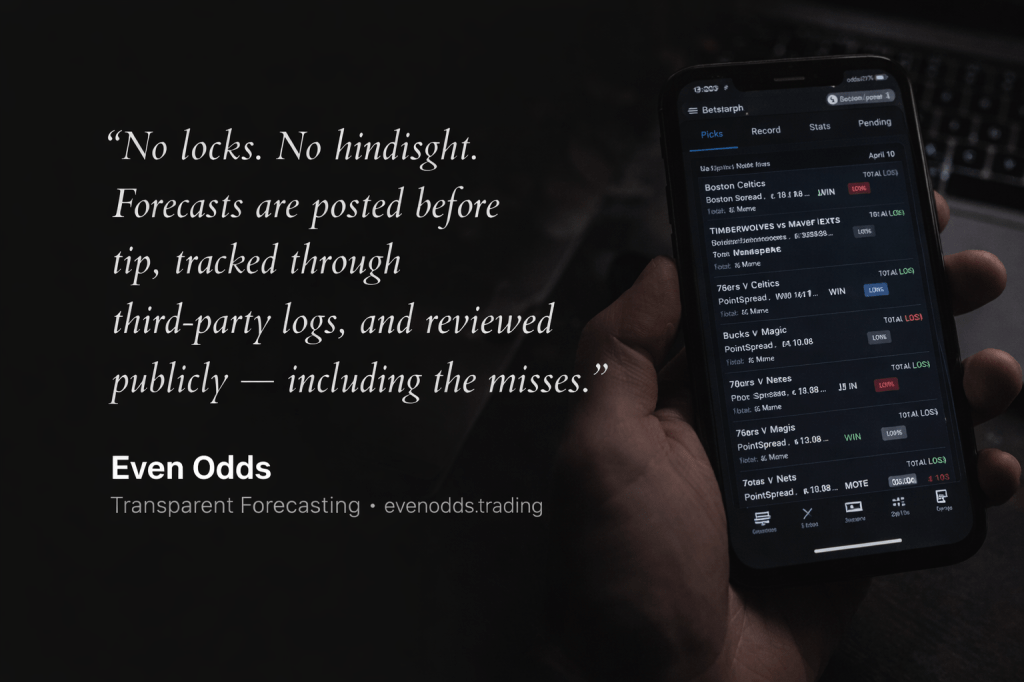
Results are tracked transparently through Betstamp. Not selective memory and cherry-picked records. Wins, losses, CLV, and the rough edges included.
Model Deep Dives
Blog posts that break down the approach: priors, calibration, validation, and what changes week to week. If a tweak improves results, you’ll see the evidence.
Visuals You Can Audit
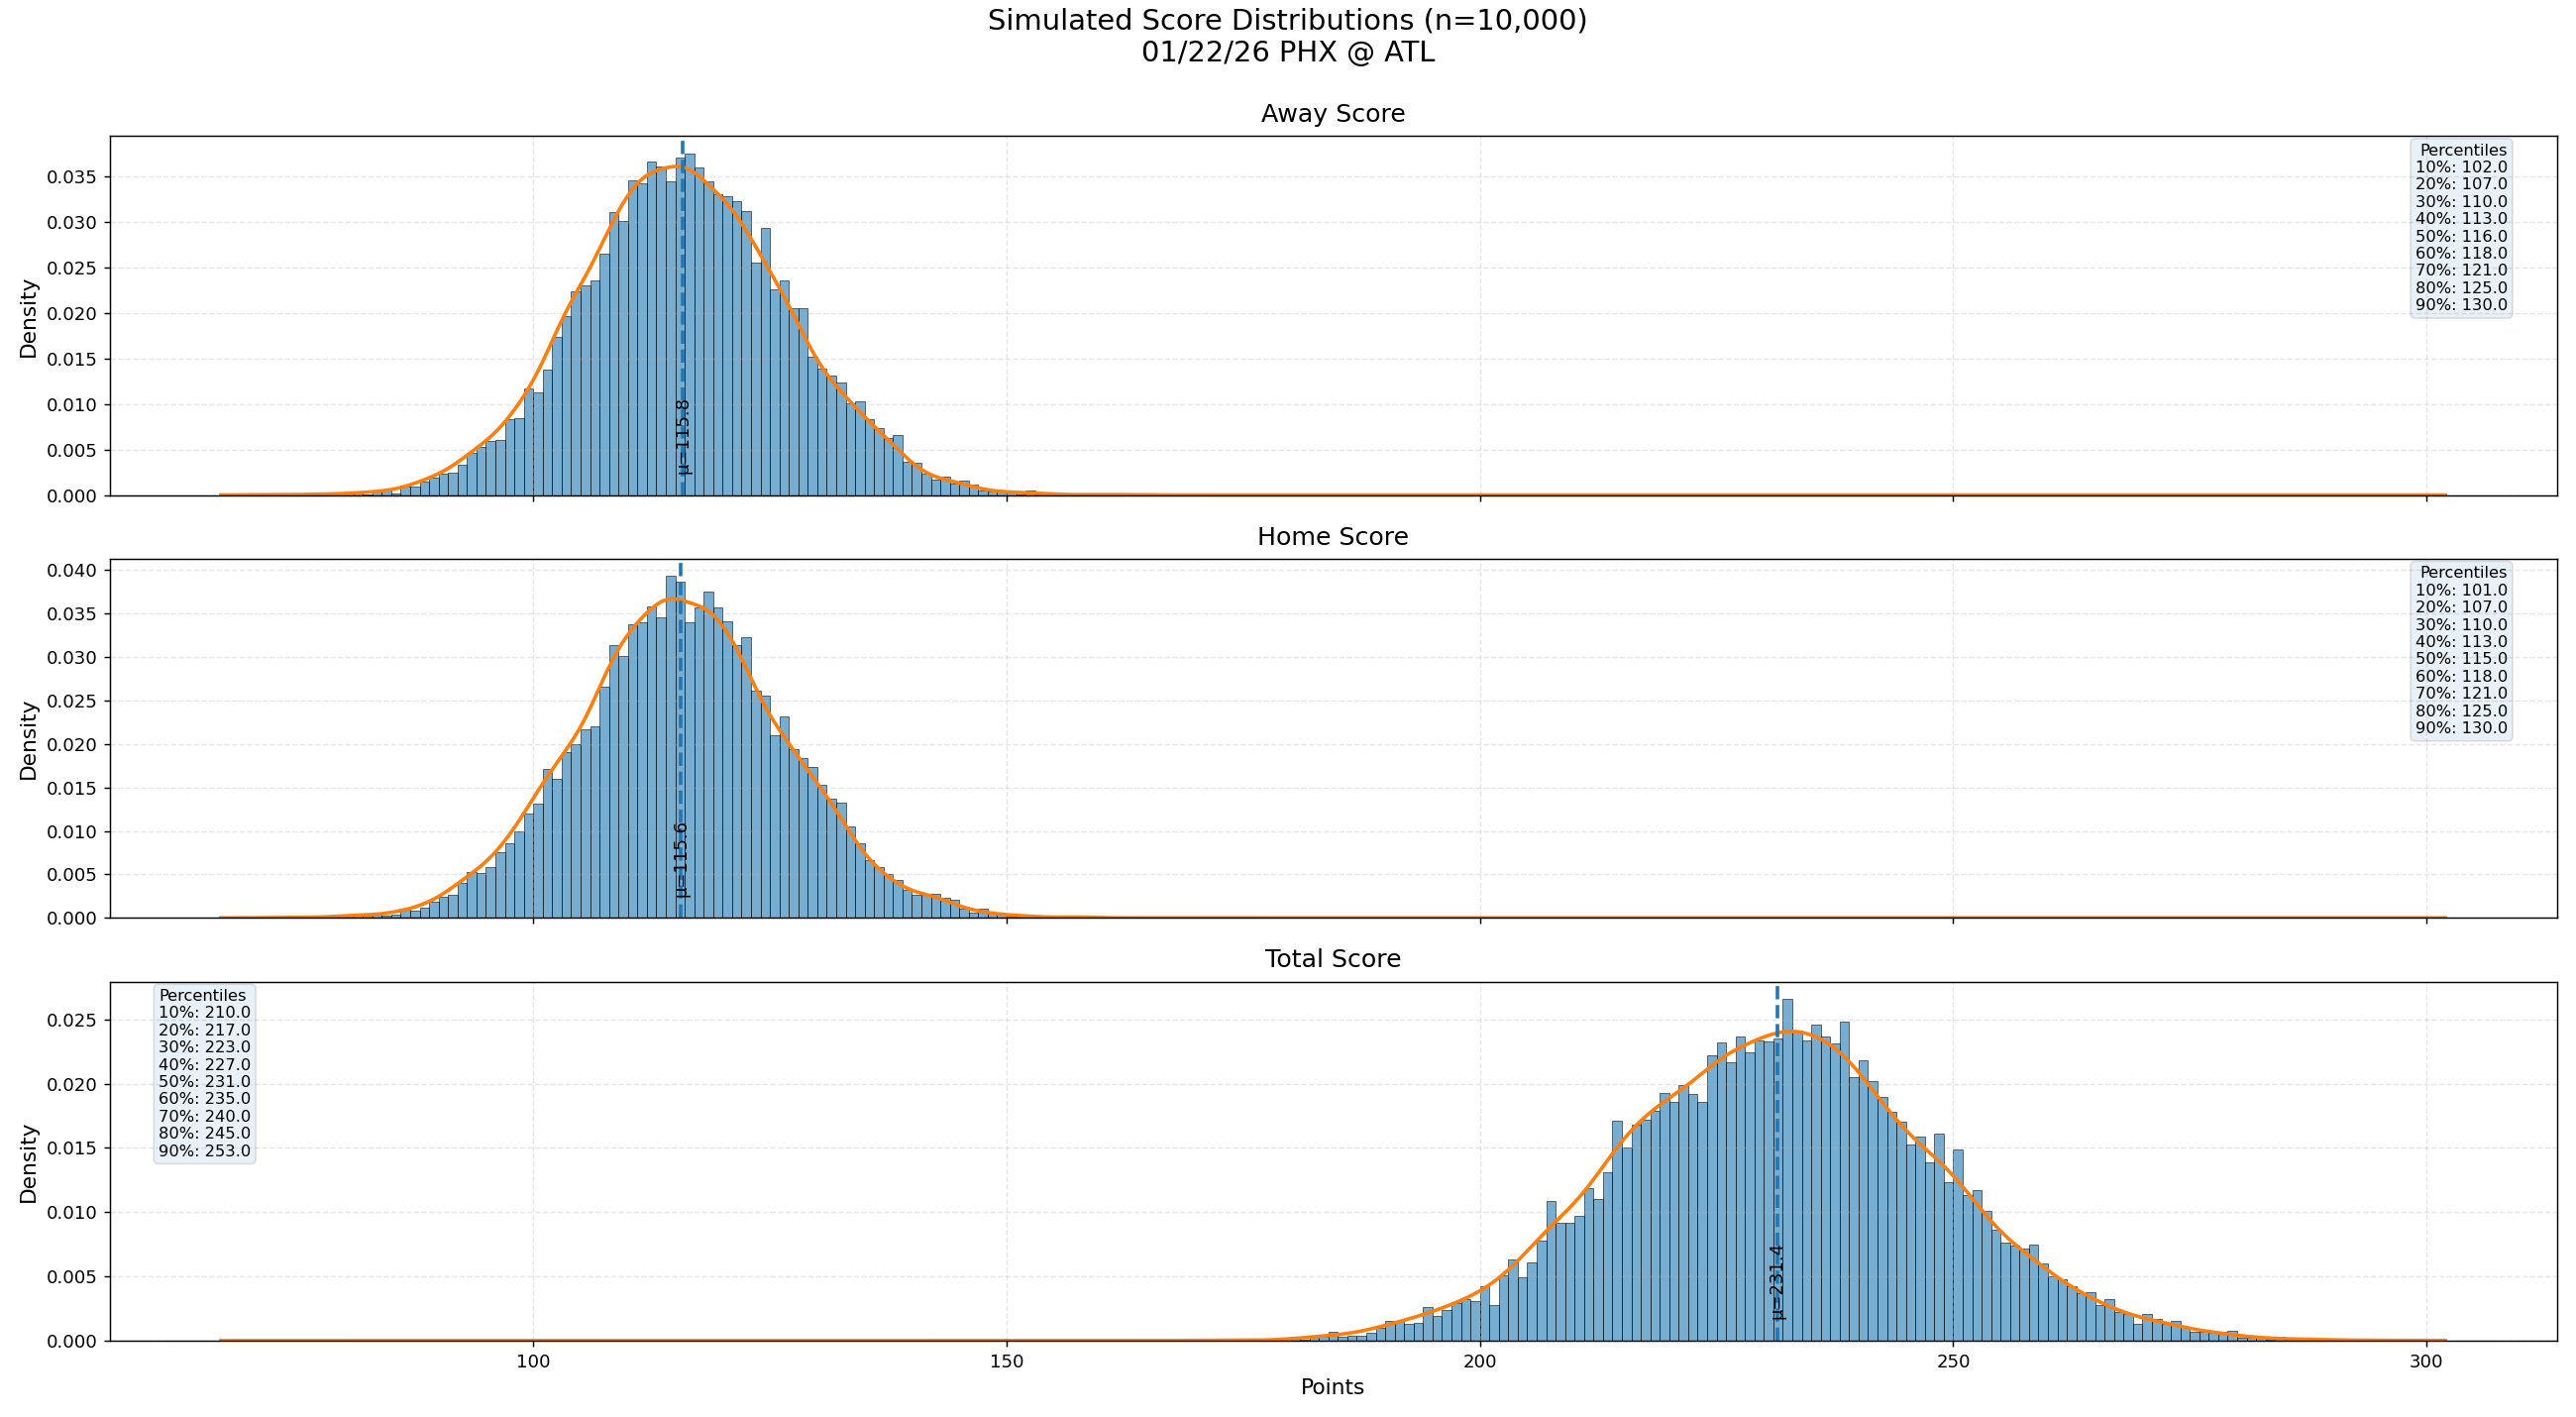
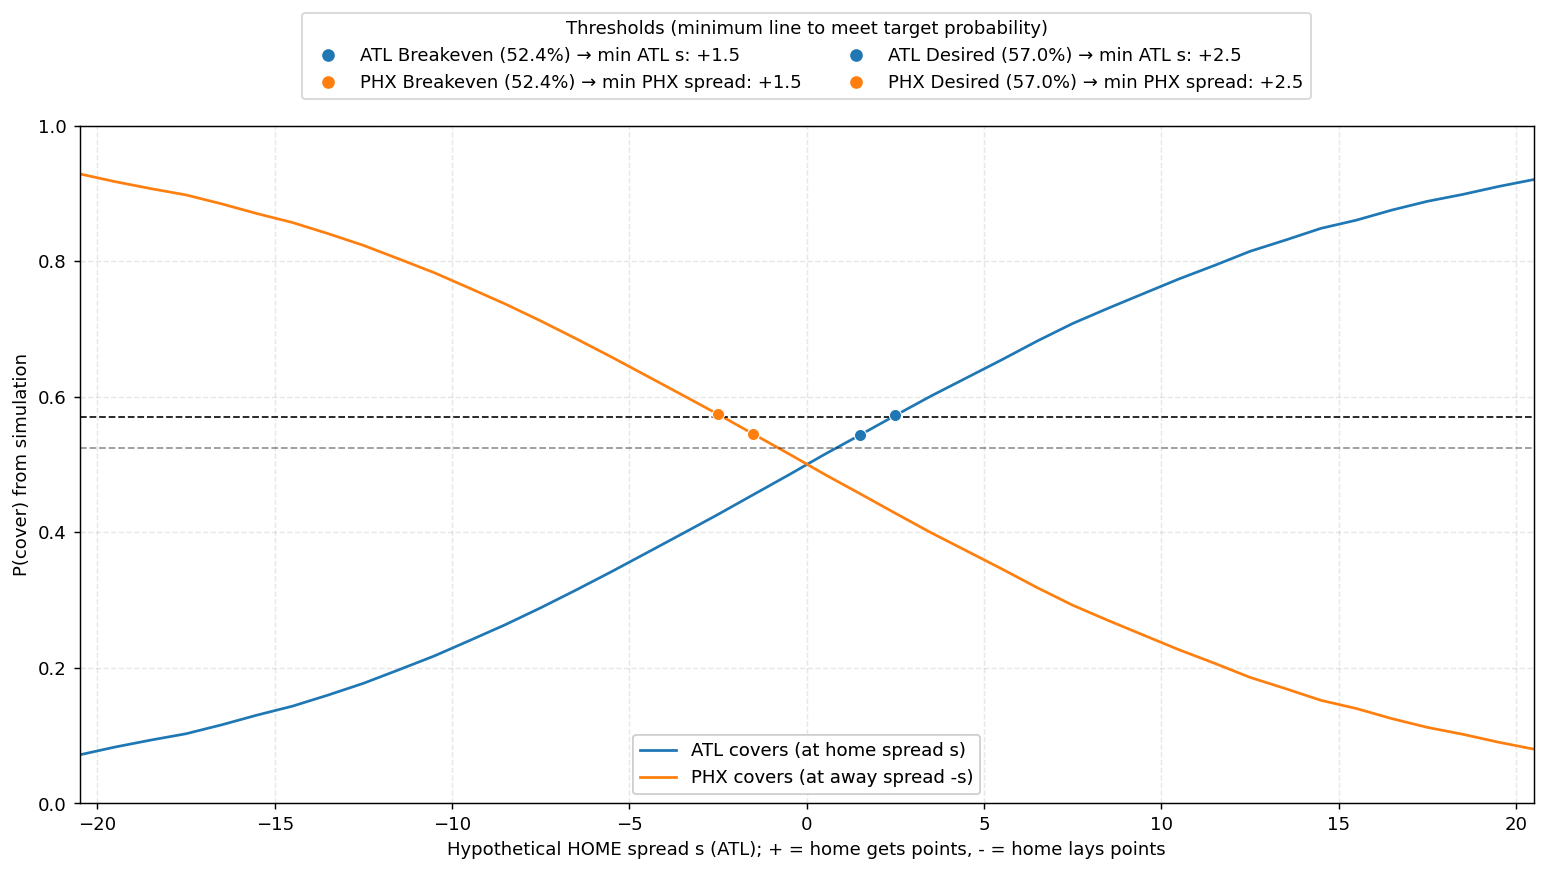
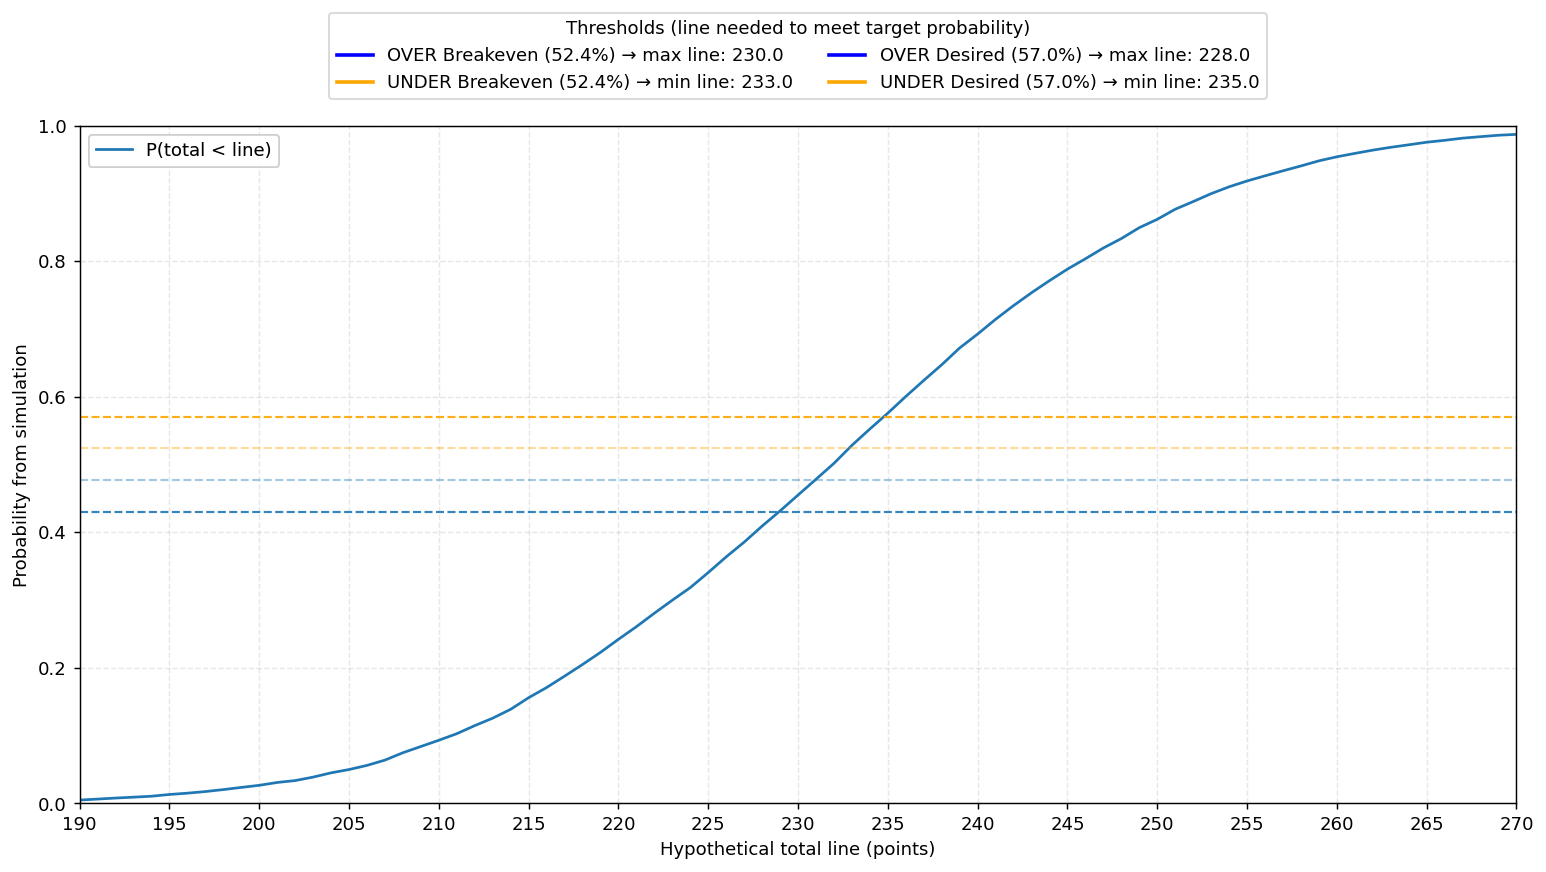
Distributions, percentile bands, and uncertainty intervals — so you can understand risk, not just point estimates. The charts are designed to be readable and reproducible.
Responsible + Transparent
No guarantees, no “locks,” no hype. Just a disciplined process, documented assumptions, and a focus on long-term decision quality.
Tools, results, and reproducible work
From play-by-play pipelines to simulation outputs — documented so others can audit and learn.
Model Dashboard (Beta)
- Daily projections with drill-downs by team, matchup, and market type.
- Calibration + accuracy monitoring (so performance is measurable).
- Interactive charts designed for quick decision-making.

The Even Odds Lab Notes
- Technical posts on modeling choices, priors, and evaluation.
- Postmortems on big swings: injuries, pace shifts, and outliers.
- Transparent tracking summaries and what’s changing next.